textPath along path
This example visualizes Arctic sea ice extent data from January to December 2016, plotting both the historical average and the 2016 measurements as smooth lines on a shared time axis. The visualization uses `d3.area` to render a shaded range between low and high historical values, with two distinct line series for average and 2016 extent. It employs the SVG `textPath` element to attach labels directly to the lines, positioning them along the curve at a fixed percentage offset. The interactive component adds a mouseover effect where a focus group with circles and annotations follows the cursor along the chart, using `d3.bisector` for date lookup and `d3.axisBottom` and `d3.axisLeft` for the time and value axes.
AI-generated descriptionFunny use of textPath svg tag.
I was thinking about to use it in a feature about global warming at the end of 2016. The textPath will follow the cursor along the path when the mouseover event is thrown.
Its a cool effect when you have a smooth line but not when the data is too much variable or irregular. So use of the feature doesnt have any sense.
The following pictures show how textPath works:
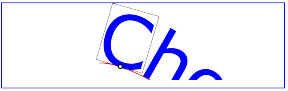
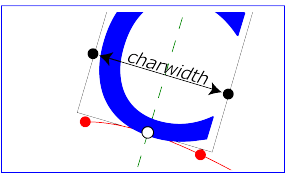
"The small dot above shows the point at which the glyph is attached to the path. The box around the glyph shows the glyph is rotated such that its horizontal axis is parallel to the tangent of the curve at the point at which the glyph is attached to the path. The box also shows the glyph's charwidth (i.e., the amount which the current text position advances horizontally when the glyph is drawn using horizontal text layout)." W3C doc
Can see live how textPath works here.