DevResults Logo
This example uses D3.js to recreate the DevResults logo mathematically, transforming a 6x6 grid of dots and a bar chart into a circular composition. The visualization demonstrates two key techniques: approximating circular dots with four Bézier curves (using the constant 0.551915024494 for control-point placement), and projecting points from a square grid onto a circle using a mathematical mapping. The result is an animated SVG logo where dots and bars warp to fit a circular envelope, with subtle color transitions, mimicking Illustrator's envelope distort effect in code.
AI-generated descriptionThis is an experiment in rendering the DevResults logo mathematically using d3.js.
The original logo was constructed in Illustrator:
<table style='min-width:900px;padding:1em'> <tr> <td width="25%"><img src='http://i.imgur.com/ZzHwN5i.png' width='200' /> </td> <td width="25%"><img src='http://i.imgur.com/Bm7Lgiw.png' width='200' /> </td> <td width="25%"><img src='http://i.imgur.com/xHqqESK.png' width='200' /> </td> <td width="25%"><img src='http://i.imgur.com/fFFwg4s.png' width='200' /> </td> </tr> <tr> <td>Create a 6x6 grid of dots.</td> <td>Overlay a circle with the same bounding box.</td> <td>Apply envelope distort using the circle.</td> <td>Add lines and color in the column chart.</td> </tr> </table>In code, the tricky part is the envelope distort. We need to do two things:
- Render the dots as shapes with geometry that can be distorted. (A
<circle>element will always be a circle - you can only manipulate the center and the radius.) - Project the original square shape of the grid onto a circle.
1. Faking a circle
If you break apart a circle in Illustrator, you'll see that it's actually composed of four Bézier curves:
<img src='http://i.imgur.com/gUFQgsl.png' width='200'/>As the internet will quickly tell you, you can't actually make a circle out of Bézier curves, but you can come close. The question is, how long should those control handles be on each point? Eyeballing it, it looks like about half the length of the radius. Turns out it's a little longer: It's <b>0.551915024494</b> times the radius. We'll call that magic number K, and drawing a fake circle becomes a simple matter of SVG:
      M ${-r,  0 }
      C ${-r, -K }
        ${-K, -r }
        ${ 0, -r }
      C ${ K, -r }
        ${ r, -K }
        ${ r,  0 }
      C ${ r,  K }
        ${ K,  r }
        ${ 0,  r }
      C ${-K,  r }
        ${-r,  K }
        ${-r,  0 }
      z
2. Circling a square
The next step is to find a projection such that any point on a unit square can be cast as a point on a unit circle. The math is not hard, but why bother when someone else has already done all the work:

The magic formula in this case turns out to be
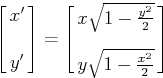
The rest is straightforward.